OP - HE.1.bone_marrow_biopsy
CM Codes
Data Overview
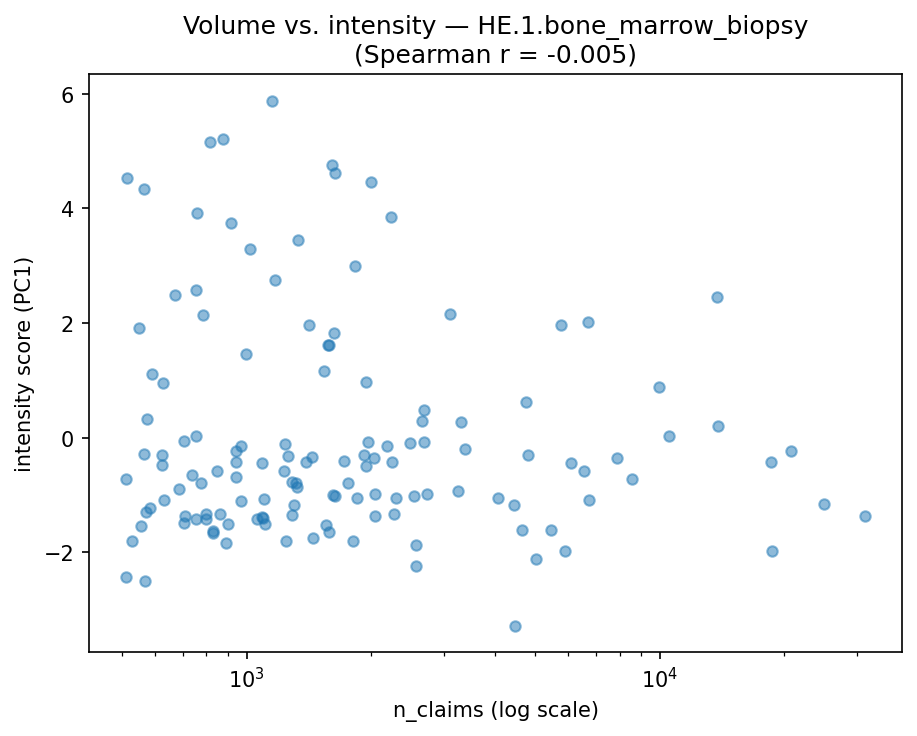
7113 total codes in komodo_rii; 134 retained after n_claims > 500 filter.
| CMS severity | n codes |
|---|---|
| No CC/MCC | 90 |
| CC | 42 |
| MCC | 2 |
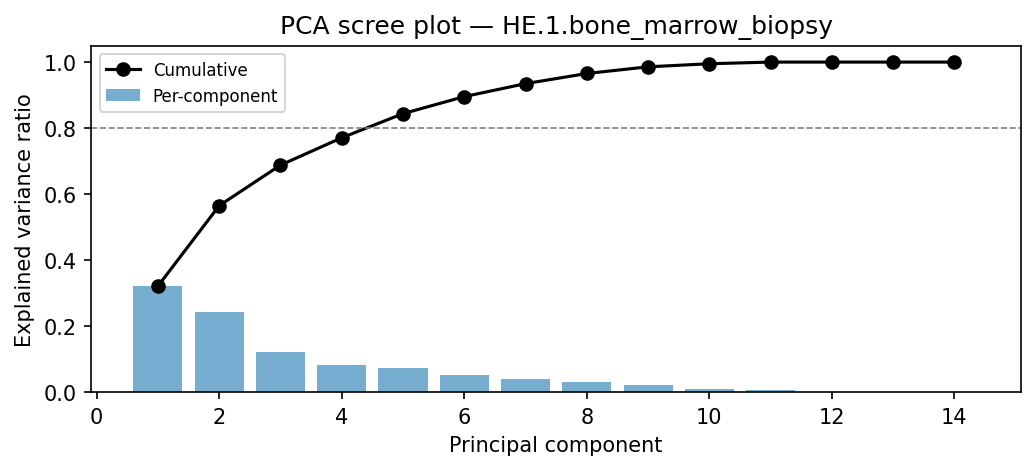
PCA Analysis
PC1 explains 32.1% of variance; PC1+PC2 together explain 56.5%.
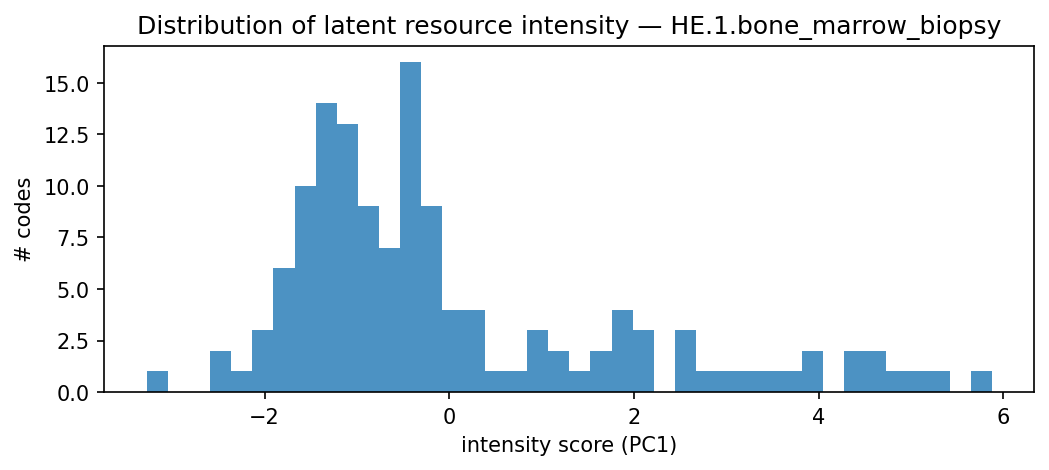
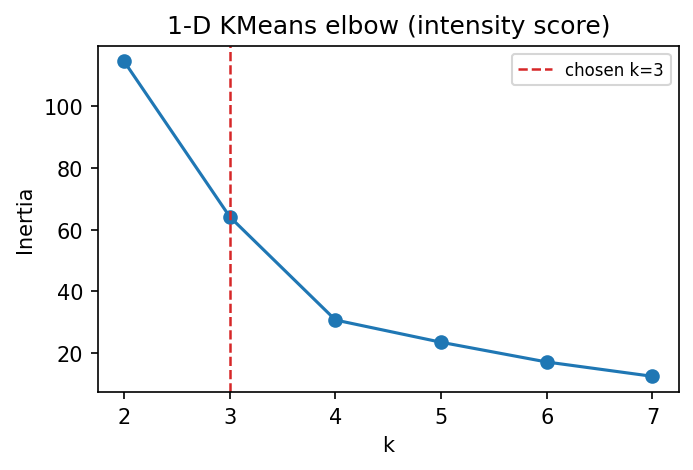
Tier Clustering (k=3)
Tier Summary
| tier | n_codes | n_claims | n distinct rev codes | n j code lines | n imaging lines | work rvu | organ system count | or | relative claim charge | transfusion |
|---|---|---|---|---|---|---|---|---|---|---|
| 1 | 99.000 | 322462.000 | 7.688 | 1.943 | 0.493 | 5.640 | 2.887 | 0.641 | 1.021 | 0.019 |
| 2 | 22.000 | 64370.000 | 8.119 | 2.023 | 0.263 | 5.349 | 2.739 | 0.529 | 1.063 | 0.059 |
| 3 | 13.000 | 15440.000 | 8.873 | 2.543 | 0.172 | 5.383 | 3.004 | 0.550 | 1.138 | 0.107 |
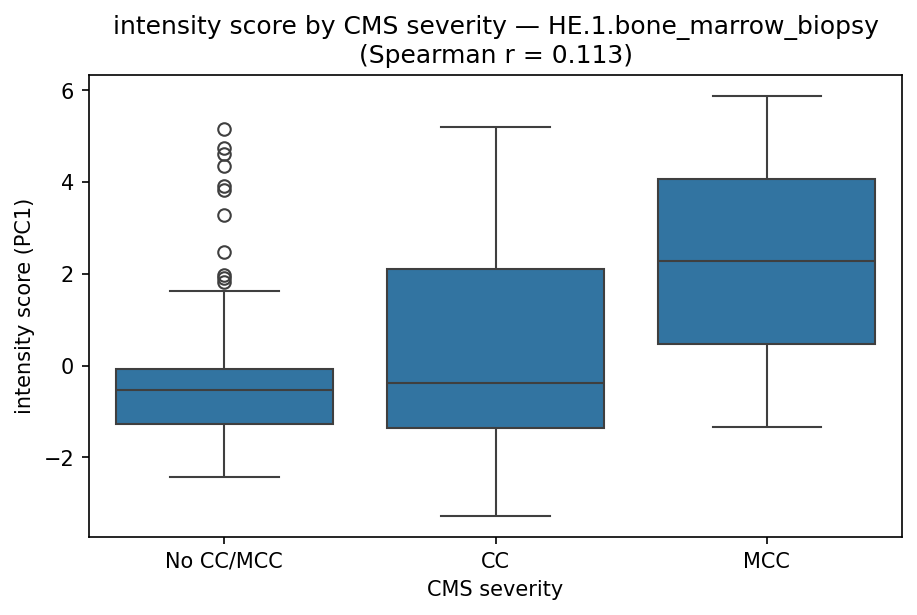
CMS Severity × intensity Tier
| cms_severity | Tier 1 | Tier 2 | Tier 3 | All |
|---|---|---|---|---|
| CC | 26 | 11 | 5 | 42 |
| MCC | 1 | 0 | 1 | 2 |
| No CC/MCC | 72 | 11 | 7 | 90 |
| All | 99 | 22 | 13 | 134 |
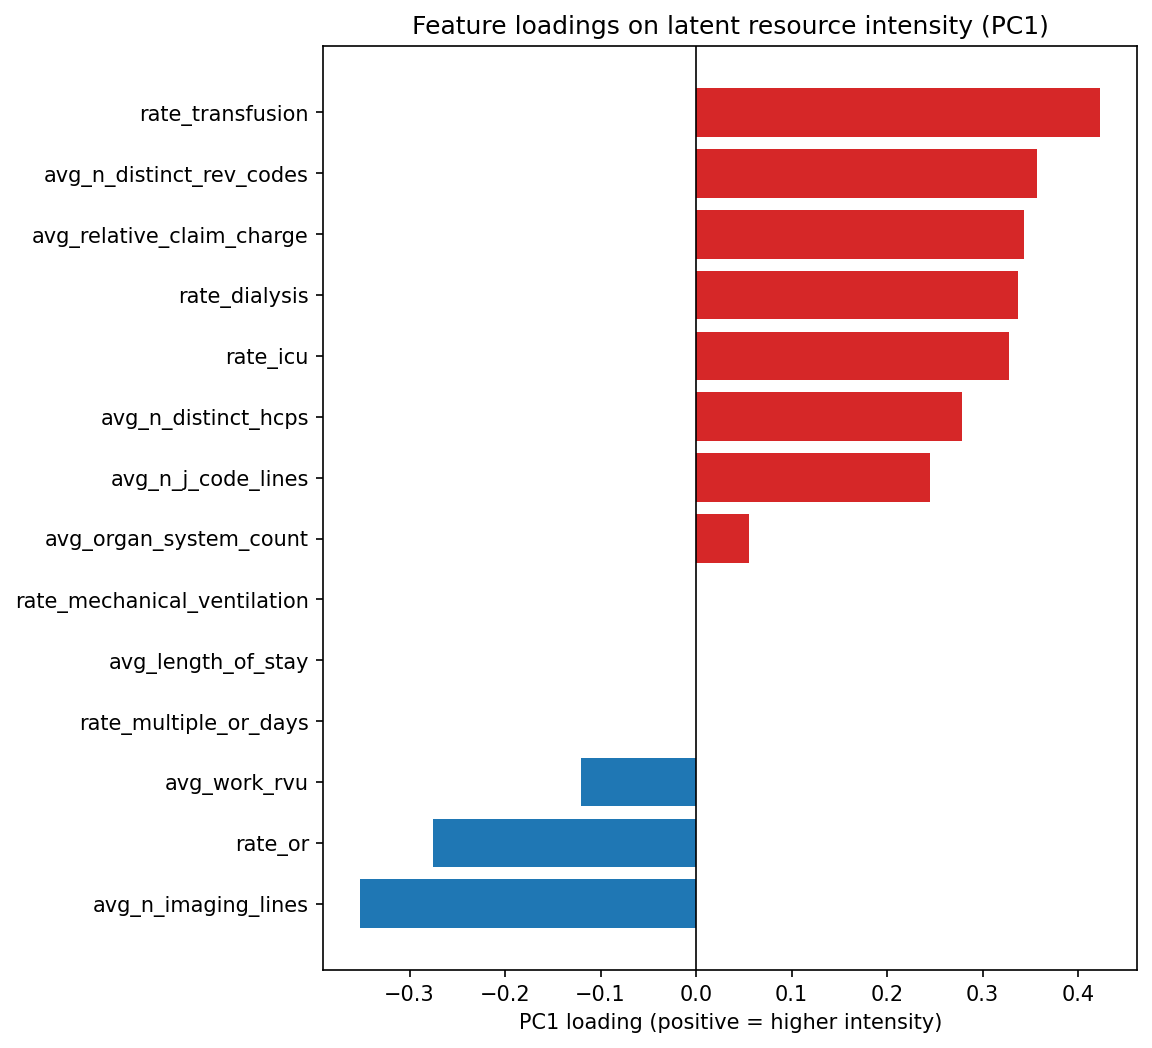
Feature Analysis
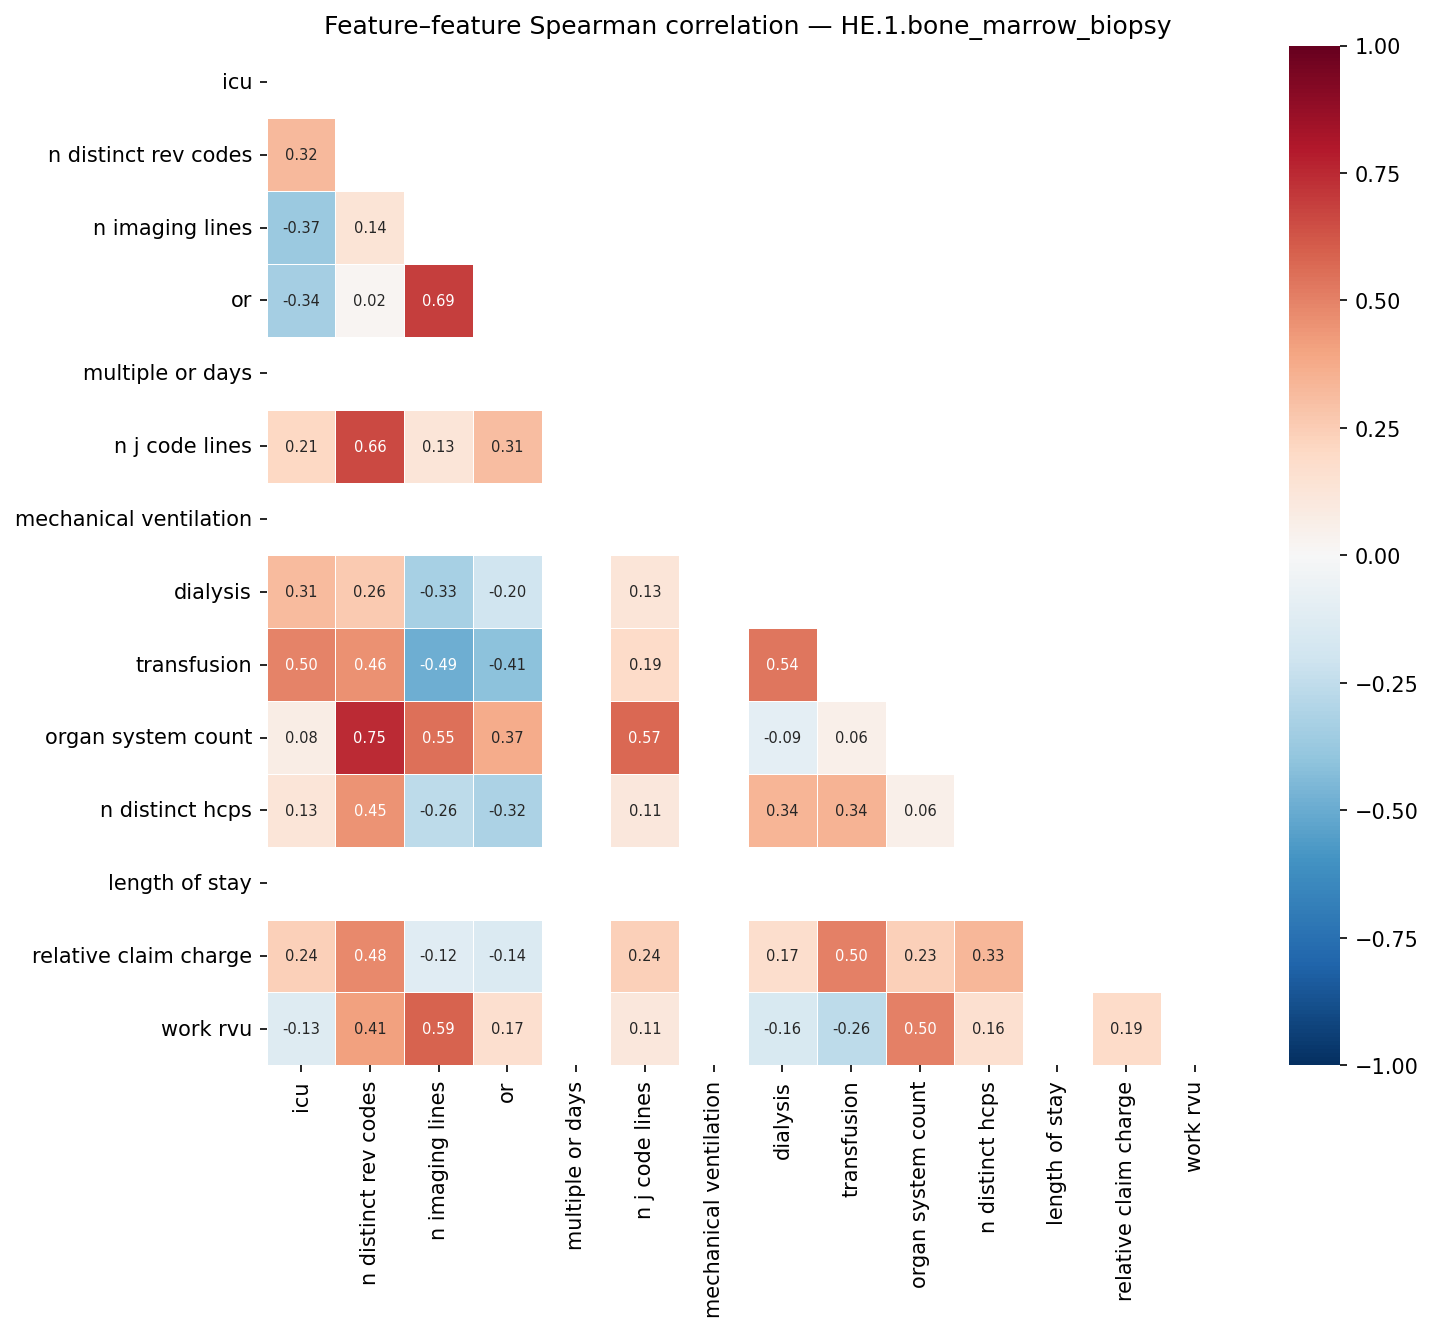
Feature Correlation
Feature Audit
| pc1_loading | r_with_volume | r_with_severity | |
|---|---|---|---|
| rate_transfusion | 0.423 | 0.004 | 0.117 |
| avg_n_distinct_rev_codes | 0.357 | -0.044 | -0.112 |
| avg_relative_claim_charge | 0.343 | -0.168 | 0.019 |
| rate_dialysis | 0.337 | 0.277 | 0.150 |
| rate_icu | 0.327 | 0.089 | 0.016 |
| avg_n_distinct_hcps | 0.278 | -0.016 | 0.144 |
| avg_n_j_code_lines | 0.245 | 0.006 | -0.278 |
| avg_organ_system_count | 0.056 | -0.068 | -0.423 |
| avg_length_of_stay | 0.000 | nan | nan |
| rate_mechanical_ventilation | 0.000 | nan | nan |
| rate_multiple_or_days | -0.000 | nan | nan |
| avg_work_rvu | -0.121 | -0.057 | -0.085 |
| rate_or | -0.276 | 0.009 | -0.381 |
| avg_n_imaging_lines | -0.351 | 0.116 | -0.362 |
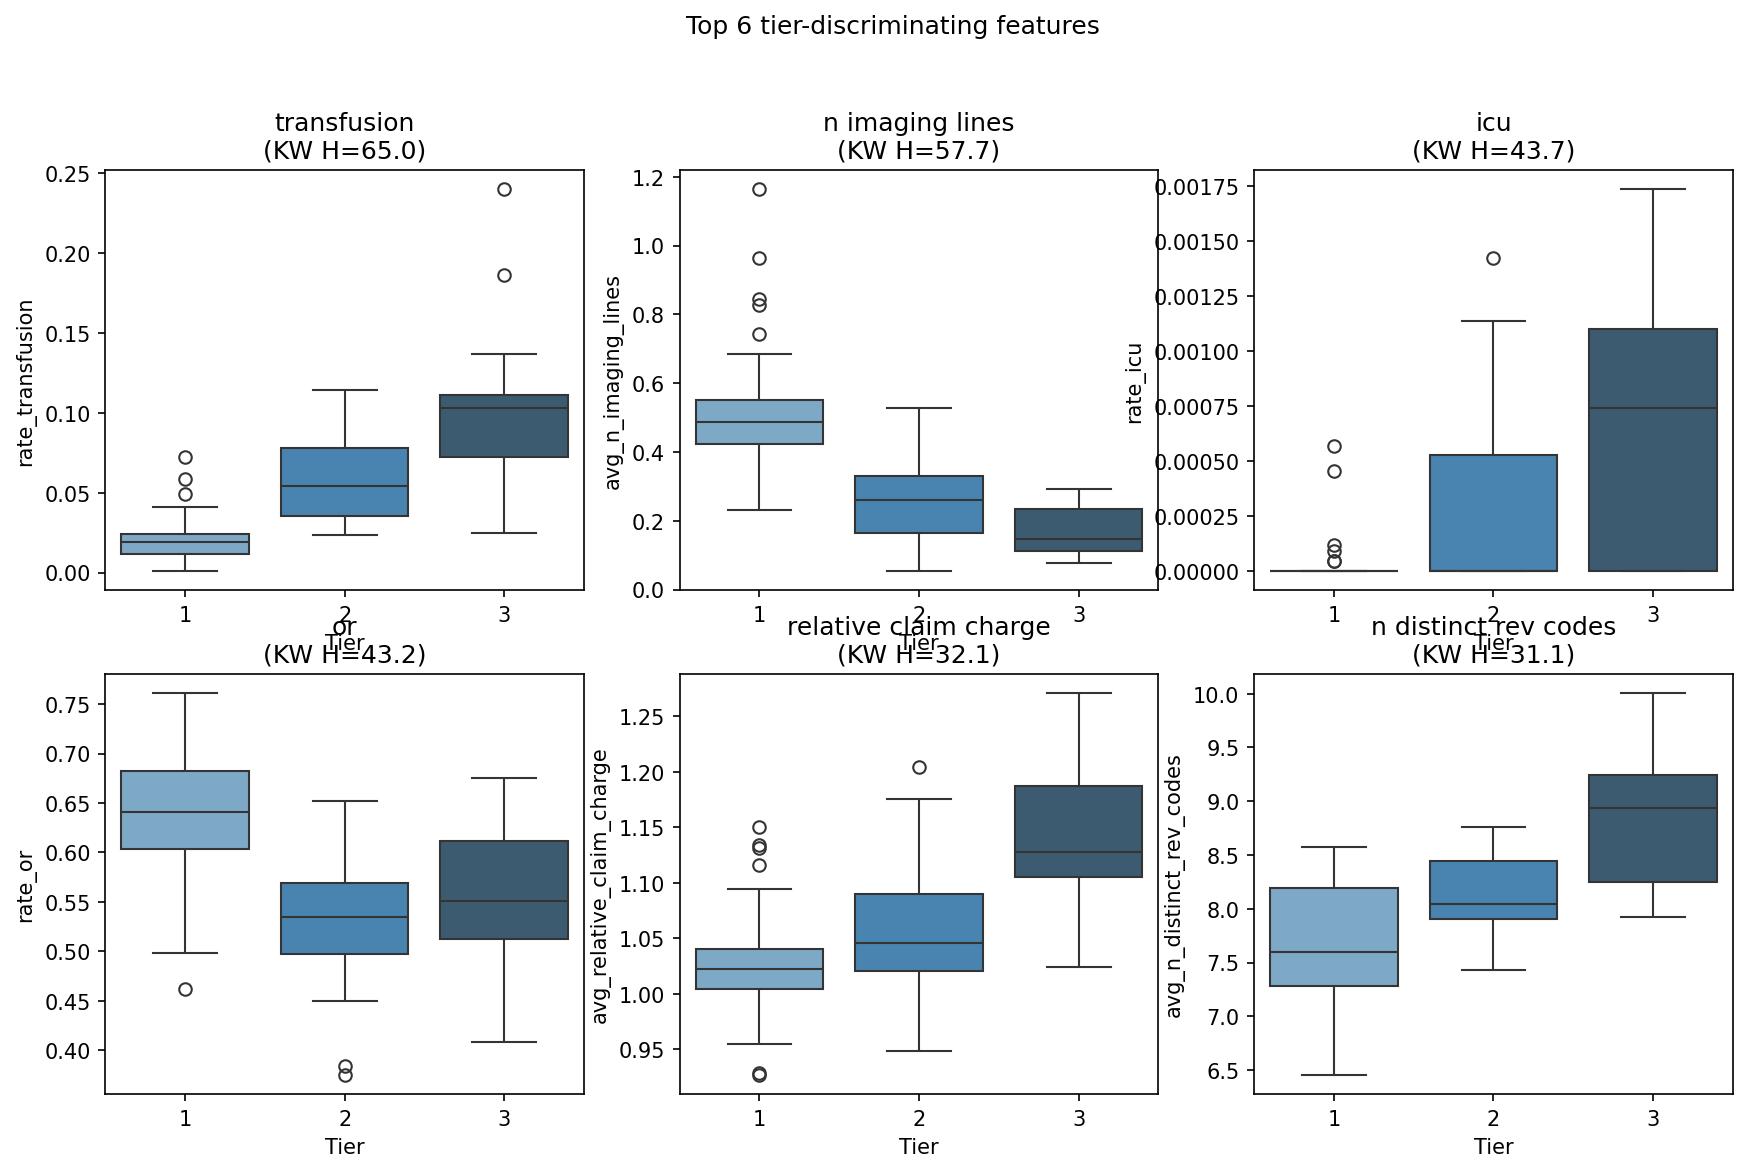
Top 6 Tier-Discriminating Features
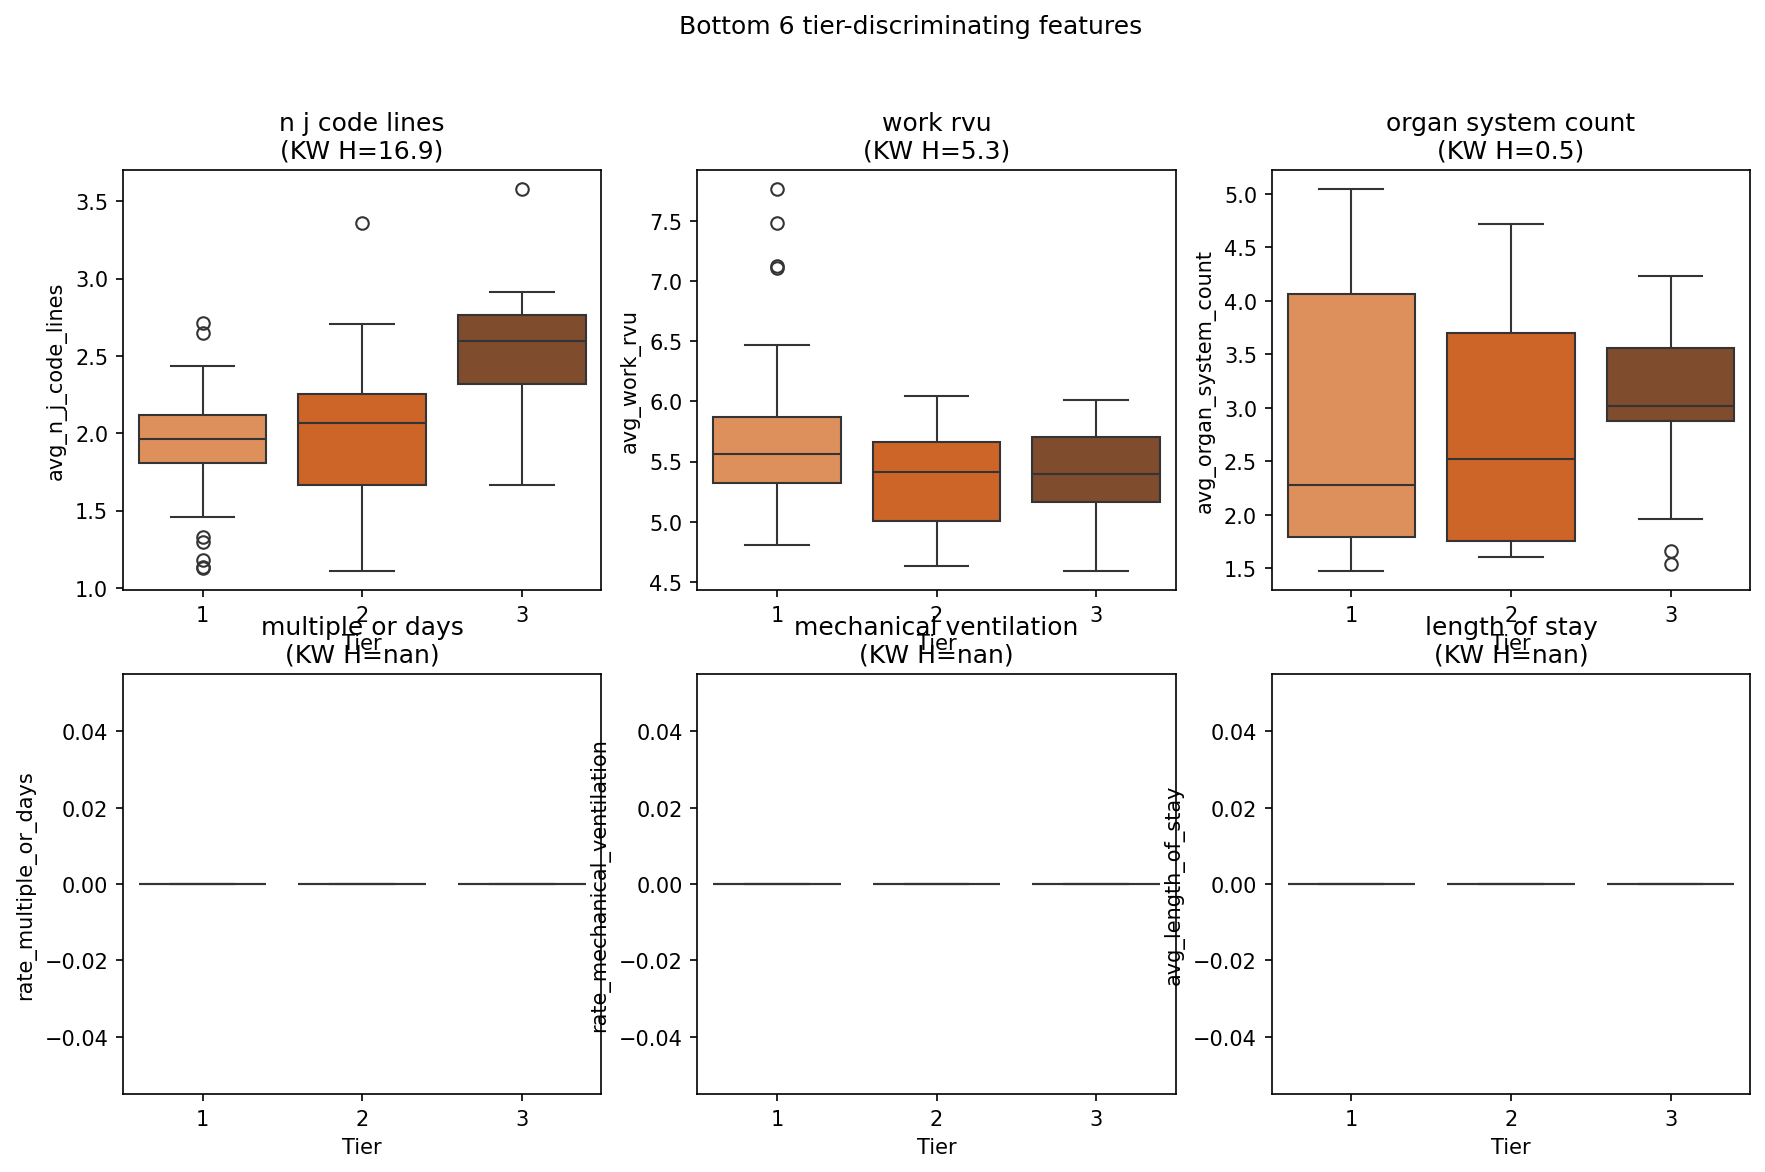
Bottom 6 Tier-Discriminating Features
Score Validation
Misclassification Audit (N=10 samples)
Over-tiered: Tier 3, No CC/MCC (5 codes)
| code | code_description | cms_severity | intensity_score | tier | n_claims | key_drivers |
|---|---|---|---|---|---|---|
| E876 | Hypokalemia | No CC/MCC | 5.153 | 3 | 818 | dialysis (+1.30), transfusion (+1.21), icu (+0.91) |
| D84821 | Immunodeficiency due to drugs | No CC/MCC | 4.753 | 3 | 1613 | icu (+1.41), n j code lines (+0.96), n distinct rev codes (+0.78) |
| E8342 | Hypomagnesemia | No CC/MCC | 4.612 | 3 | 1634 | icu (+0.84), n distinct rev codes (+0.76), n imaging lines (+0.67) |
| K5900 | Constipation, unspecified | No CC/MCC | 4.345 | 3 | 564 | icu (+1.37), n distinct rev codes (+0.57), n imaging lines (+0.48) |
| D6481 | Anemia due to antineoplastic chemotherapy | No CC/MCC | 3.910 | 3 | 757 | relative claim charge (+1.35), icu (+0.89), transfusion (+0.81) |
Under-tiered: Tier 1, MCC (1 codes)
| code | code_description | cms_severity | intensity_score | tier | n_claims | key_drivers |
|---|---|---|---|---|---|---|
| N186 | End stage renal disease | MCC | -1.330 | 1 | 800 | relative claim charge (-0.36), or (-0.31), n distinct hcps (-0.29) |
Top Codes by Tier
Tier 1 (n=99 codes)
| code | Description | CMS severity | Score | N claims | Key drivers |
|---|---|---|---|---|---|
| D72818 | Other decreased white blood cell count | No CC/MCC | 0.326 | 574 | relative claim charge (+0.54), or (-0.47), dialysis (+0.39) |
| I4891 | Unspecified atrial fibrillation | No CC/MCC | 0.291 | 2652 | n distinct rev codes (+0.23), n distinct hcps (+0.19), n imaging lines (-0.15) |
| D849 | Immunodeficiency, unspecified | CC | 0.275 | 3310 | n imaging lines (-1.06), relative claim charge (+0.56), icu (+0.41) |
| D61818 | Other pancytopenia | CC | 0.200 | 13855 | transfusion (+0.45), n distinct rev codes (-0.16), n distinct hcps (-0.12) |
| E785 | Hyperlipidemia, unspecified | No CC/MCC | 0.030 | 10537 | n distinct rev codes (+0.22), n imaging lines (-0.15), n j code lines (+0.14) |
| K760 | Fatty (change of) liver, not elsewhere classified | No CC/MCC | 0.027 | 756 | dialysis (-0.25), n distinct hcps (+0.21), icu (-0.12) |
| M109 | Gout, unspecified | No CC/MCC | -0.065 | 706 | n distinct rev codes (+0.26), dialysis (-0.25), relative claim charge (+0.20) |
| G629 | Polyneuropathy, unspecified | No CC/MCC | -0.072 | 1964 | n distinct hcps (+0.41), n distinct rev codes (+0.29), dialysis (-0.25) |
| E7800 | Pure hypercholesterolemia, unspecified | No CC/MCC | -0.082 | 2684 | n j code lines (+0.25), transfusion (-0.25), n distinct hcps (+0.23) |
| C9210 | Chronic myeloid leukemia, BCR/ABL-positive, not having achieved remission | CC | -0.100 | 2489 | dialysis (+0.59), relative claim charge (-0.49), n distinct rev codes (-0.36) |
Tier 2 (n=22 codes)
| code | Description | CMS severity | Score | N claims | Key drivers |
|---|---|---|---|---|---|
| C9310 | Chronic myelomonocytic leukemia not having achieved remission | CC | 2.993 | 1825 | dialysis (+1.47), or (+0.58), transfusion (+0.53) |
| C9102 | Acute lymphoblastic leukemia, in relapse | CC | 2.757 | 1170 | n j code lines (+0.83), n imaging lines (+0.72), transfusion (+0.61) |
| D89813 | Graft-versus-host disease, unspecified | CC | 2.580 | 753 | relative claim charge (+0.71), n imaging lines (+0.65), or (+0.42) |
| G4700 | Insomnia, unspecified | No CC/MCC | 2.488 | 672 | icu (+1.20), n distinct rev codes (+0.51), relative claim charge (+0.30) |
| C9200 | Acute myeloblastic leukemia, not having achieved remission | CC | 2.448 | 13752 | transfusion (+0.93), dialysis (+0.86), n imaging lines (+0.53) |
| C9101 | Acute lymphoblastic leukemia, in remission | CC | 2.154 | 3109 | n imaging lines (+0.69), icu (+0.57), n distinct hcps (+0.46) |
| N179 | Acute kidney failure, unspecified | CC | 2.133 | 786 | icu (+0.94), n distinct rev codes (+0.49), transfusion (+0.35) |
| C9100 | Acute lymphoblastic leukemia not having achieved remission | CC | 2.024 | 6714 | n imaging lines (+0.64), relative claim charge (-0.53), dialysis (+0.44) |
| N400 | Benign prostatic hyperplasia without lower urinary tract symptoms | No CC/MCC | 1.970 | 1416 | relative claim charge (+0.96), icu (+0.51), n distinct rev codes (+0.25) |
| C9201 | Acute myeloblastic leukemia, in remission | CC | 1.956 | 5761 | n imaging lines (+0.64), dialysis (+0.53), transfusion (+0.39) |
Tier 3 (n=13 codes)
| code | Description | CMS severity | Score | N claims | Key drivers |
|---|---|---|---|---|---|
| D61810 | Antineoplastic chemotherapy induced pancytopenia | MCC | 5.878 | 1155 | transfusion (+1.79), relative claim charge (+0.95), dialysis (+0.79) |
| T865 | Complications of stem cell transplant | CC | 5.209 | 877 | n distinct rev codes (+1.21), n distinct hcps (+1.04), relative claim charge (+0.86) |
| E876 | Hypokalemia | No CC/MCC | 5.153 | 818 | dialysis (+1.30), transfusion (+1.21), icu (+0.91) |
| D84821 | Immunodeficiency due to drugs | No CC/MCC | 4.753 | 1613 | icu (+1.41), n j code lines (+0.96), n distinct rev codes (+0.78) |
| E8342 | Hypomagnesemia | No CC/MCC | 4.612 | 1634 | icu (+0.84), n distinct rev codes (+0.76), n imaging lines (+0.67) |
| D89811 | Chronic graft-versus-host disease | CC | 4.527 | 515 | n distinct rev codes (+1.21), relative claim charge (+0.96), n distinct hcps (+0.78) |
| C9202 | Acute myeloblastic leukemia, in relapse | CC | 4.454 | 1999 | transfusion (+2.43), dialysis (+0.66), n imaging lines (+0.64) |
| K5900 | Constipation, unspecified | No CC/MCC | 4.345 | 564 | icu (+1.37), n distinct rev codes (+0.57), n imaging lines (+0.48) |
| D6481 | Anemia due to antineoplastic chemotherapy | No CC/MCC | 3.910 | 757 | relative claim charge (+1.35), icu (+0.89), transfusion (+0.81) |
| T451X5A | Adverse effect of antineoplastic and immunosuppressive drugs, initial encounter | No CC/MCC | 3.840 | 2234 | transfusion (+0.78), n distinct rev codes (+0.62), n j code lines (+0.55) |
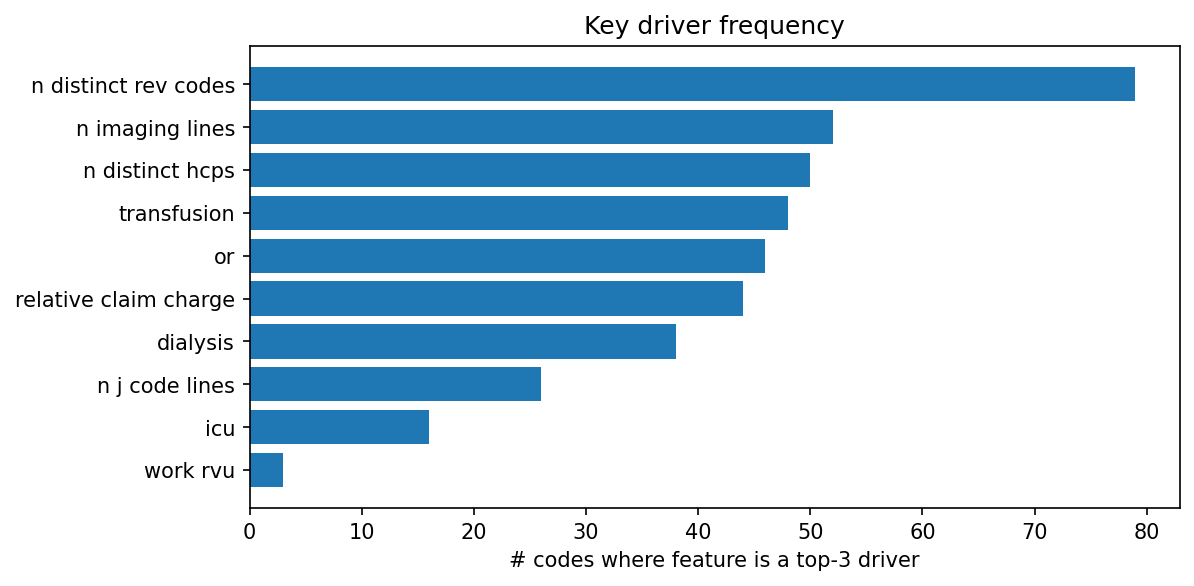
Key Driver Frequency
| feature | count | pct |
|---|---|---|
| n distinct rev codes | 79 | 59.000 |
| n imaging lines | 52 | 38.800 |
| n distinct hcps | 50 | 37.300 |
| transfusion | 48 | 35.800 |
| or | 46 | 34.300 |
| relative claim charge | 44 | 32.800 |
| dialysis | 38 | 28.400 |
| n j code lines | 26 | 19.400 |
| icu | 16 | 11.900 |
| work rvu | 3 | 2.200 |